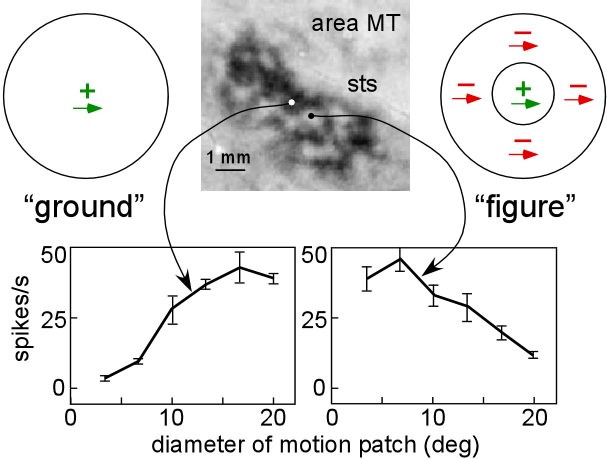
Correlation of 2-deoxyglucose (2dg) labelling and neuronal receptive field properties in visual area MT of the owl monkey. The gray-level image is an autoradiograph of a section through area MT cut parallel to the cortical surface. The pattern of 2dg uptake was produced by showing the monkey a large-field pattern of random dots (covering ~60 degrees of the visual field) that moved coherently at systematically varied directions and speeds while the 2dg was infused intravenously. Regions of high 2dg uptake appear dark (bands), while regions of 2dg uptake equal to unstimulated cortex are lighter (interbands). The line drawings immediately below the 2dg image depict the responses of two neurons to patches of random dots moving in the cell's preferred direction and speed as a function of the size of the random dot patch (area response test). Neurons in the bands respond more vigorously as the area of the random dot patch increases; neurons in the interbands respond well to small patches of motion but are indifferent to large-field motion.